In today’s game starting pitchers rarely go the distance anymore. The days of the ‘finish what you started’ mentality are behind us. Starting pitchers are not pitching as deep into games any more and rarely pitch into the later innings. A lot of this can be attributed to a shift of focus to pitch counts and pitcher fatigue, but there are a few other recent trends that are playing into shorter starts.
In 2013 there were 161 pitchers used exclusively as starters (5.4 per team), meaning they never made an appearance out of the bullpen during the regular season. Additionally in 2013 there were 62 pitchers to make 30+ starts. In 2013 those 161 pitchers pitchers pitched 114 complete games, with a season ERA of 3.79 and 7.3 K/9, going about 6.07 IP/G. There were a total of 131 complete games that season, and 73 of them were pitched by the starters that made 30+ starts.
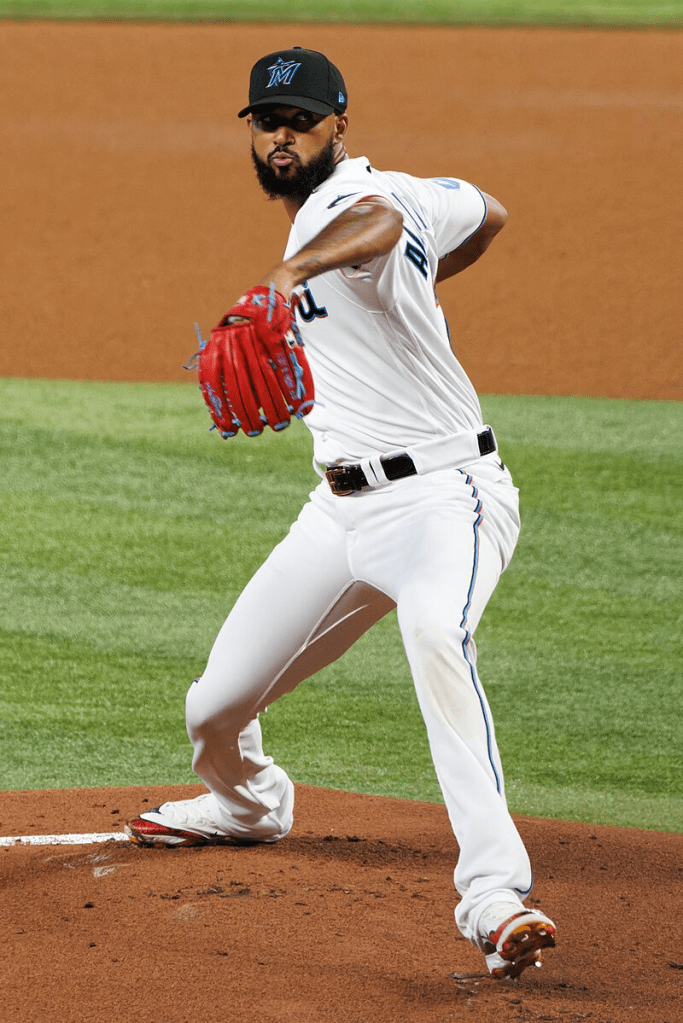
Shifting to this past season, in 2023, there were also 161 pitchers used exclusively as starters (5.4 per team), and there were just 42 that made 30+ starts. 27 year old Sandy Alcantara & 32 year old Jordan Lyles led the league with 3 complete games each. In 2023 the 161 exclusively starting pitchers had just 31 complete games with a season ERA of 4.15 and 8.7 K/9, going about 5.5 IP/G. There were a total of 36 complete games in 2023, and 16 of them were pitched by starters who made 30+ starts.
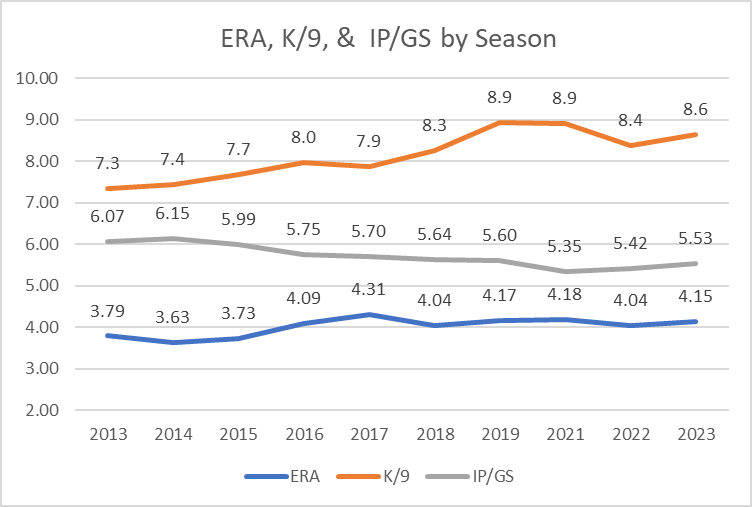
Over the past 10 seasons (excluding shortened 2020 season), there has been a clear trend among starting pitchers. ERA has risen from consistently being below 3.79 in 2013 to being north of 4.00 with a 4.15 ERA in 2023. Pitchers are also not pitching past the 6th inning with an average length of a start of 6.07 IP in 2013 to just 5.5 IP/GS in 2023. Those two metrics may be correlated, given that a pitcher doesn’t have the opportunity to get more outs and perhaps lower his ERA, but both may be related to K/9.
Pitchers are striking out more batters than ever, the only time the league’s K/9 as a total was above 9.0 was in 2020, prior to 2016 it was never higher than 8.0, and prior to 2009 it was never higher than 7.0.
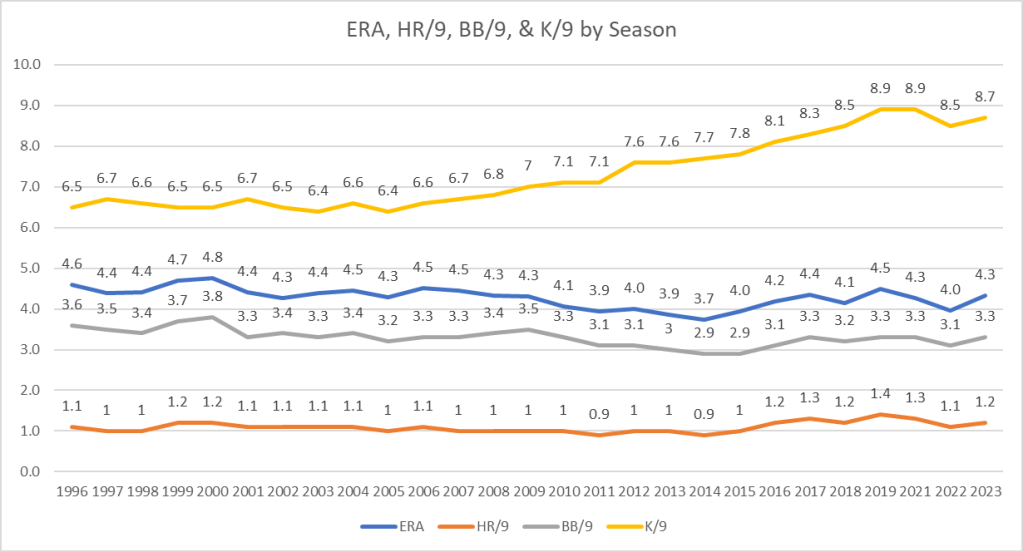
During the Steroid Era, pitcher ERA was higher, but HR/9 and BB/9 remained relatively consistent even through 2023, the most staggering trend is K/9 increasing from 6.5 K/9 in 1996 to 8.7 in 2023. This could simply explain why pitchers aren’t pitching deeper into games in recent years. It takes at least 3 pitches to strikeout a batter, but only 1 for them to get out via a batted ball.
Placing an emphasis on strikeouts could be leading to shorter starts and less pitchers making 30+ starts. Teams are more aware of pitch counts, and racking up strikeouts in the early innings reaches that limit faster. Additionally throwing harder and with more intensity may be leading to more pitcher injury.
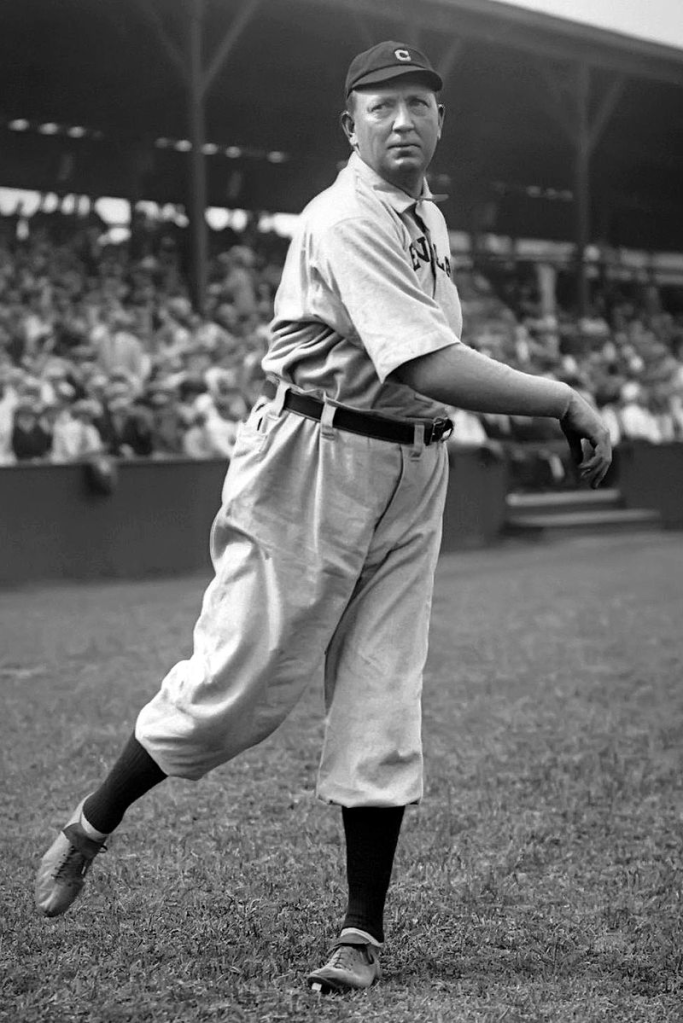
Cy Young, for whom the award to the award is named after, holds the record for most complete games and innings pitched in MLB history. The right handed pitcher started the most games in MLB history with 815, accumulated a total of 7356.0 IP and pitched 749 complete games. Young pitched from 1890-1911 for 22 seasons, a long time removed from the current game. Young’s K/9 was 3.4 for his career, peaking at 5.9 in 1905.
As recent as the 21st century, there were pitchers that would go the distance. Roy Halladay led the league in complete games every season from 2007-2011, earning 67 total in his career 416 games started. Halladay had a career 6.9 K/9, peaking at 8.5 in 2011.
The shift in the game to more intense outings from starting pitchers, generating more strikeouts, and shorter time in the game, has led to the importance of relief pitching. Relievers are going to be depended on more if the current trend continues. They’ll be asked to pitch larger portions of the game and more often.
Felix Bautista led all relief pitchers making 30+ appearances in K/9 in 2023 with a 16.2 K/9. In 2013 Aroldis Chapman lead relivers in K/9 with 15.8, he finished right behind Bautista in 2023 with a 15.9 K/9. Relief pitchers differ from starting pitchers as they can pitch with more intensity for shorter periods of time. The shift in reliever effectiveness from 2013-2023 is relatively consistent, as opposed to trend for starting pitchers.
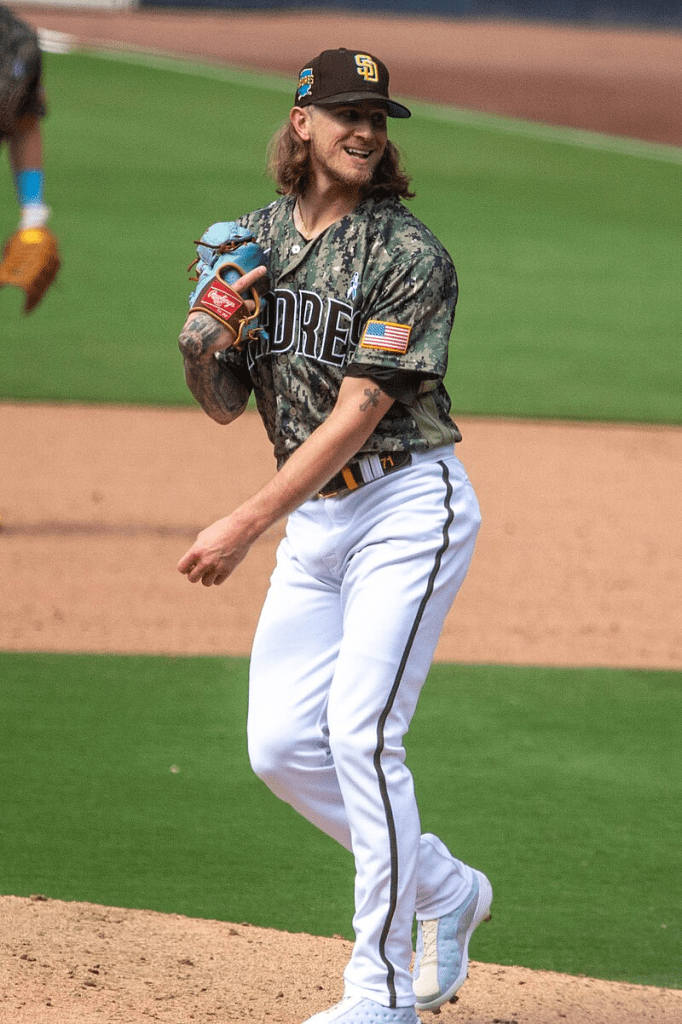
There were 118 free agent relivers for teams to sign at the start of the offseason, and many of them will be demanding big contracts. Josh Hader will likely be the biggest winner this offseason among relief pitchers, posting a 1.28 ERA in 61 games and 56.1 IP with a 13.6 K/9 in 2023. The 29 year old has been effective his first 7 seasons in the league, with only 1 bad season in 2022, when he had a 5.22 ERA with the Brewers & Padres, but has since bounced back.
With the added importance of relief pitching, Hader can demand a contract similar to the one Aroldis Chapman received in 2016 (5 years/$86M), Kenley Jansen’s deal in 2016 (5 years/$80M), or Edwin Diaz’s contract with the Mets in 2022 (5 years/$102M). The deals the best relievers are signing are coming in at high average annual values, which used to be reserved for starting pitching, but they are becoming more and more important to the game.
In 2024 its safe to expect similar results to 2023, starting pitchers racking up strikeouts at a high rate, and raising their pitch count prior to the 6th inning. The bullpen will come in and shut the game down with strikeouts at even higher rate. Since elite starters who pitch deeper into games are becoming more rare, this places more value on the bullpen arms, but also increases the value of the few starting pitchers who can consistently stay on the field and eat up innings. We’ll see plenty of starting pitchers sign lucrative deals as well.

.jpg)