2023 was a year of adjustment for much of the league with several rule changes being implemented, including the pitch clock, defensive shift limits, larger bases, and limits to pitcher-batter disengagements. The league quickly adjusted and offensive production was up in nearly every category. In 2023, there were 22,342 runs scored (+8.8% YoY), 21,512 RBIs (+8.2% YoY), 5,868 HR (+12.5% YoY), 3,503 SB (+40.9% YoY), and the league produced an average slashline of .248/.320/.414 (vs last season .243/.312/.395).
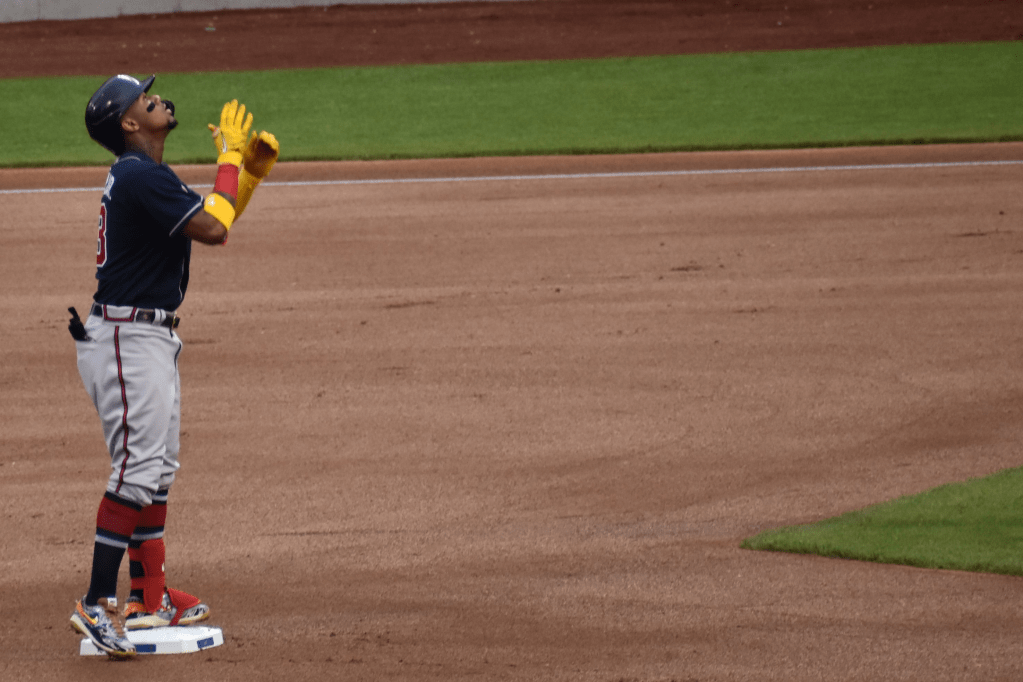
There were 655 unique batters to have at least 1 plate appearance in 2023, and many of them were able to capitalize on their opportunities. Ronald Acuna Jr led the league in runs scored & stolen bases with 149 & 73 respectively and Braves teammate, Matt Olson led the league in RBIs & home runs with 139 & 54 respectively. The Braves collectively as a team scored 947 Runs and collected 916 RBIs and ~80% of that production came from 34.8% of their batters.
The Pareto Principle states that for many outcomes, roughly 80% of consequences come from 20% of causes. The principle doesn’t have to be concretely 80/20, but an evaluation at a macro scale reveals several real world examples, such as global populations, where 15% of countries contain 80% of the population. The same holds true for baseball.
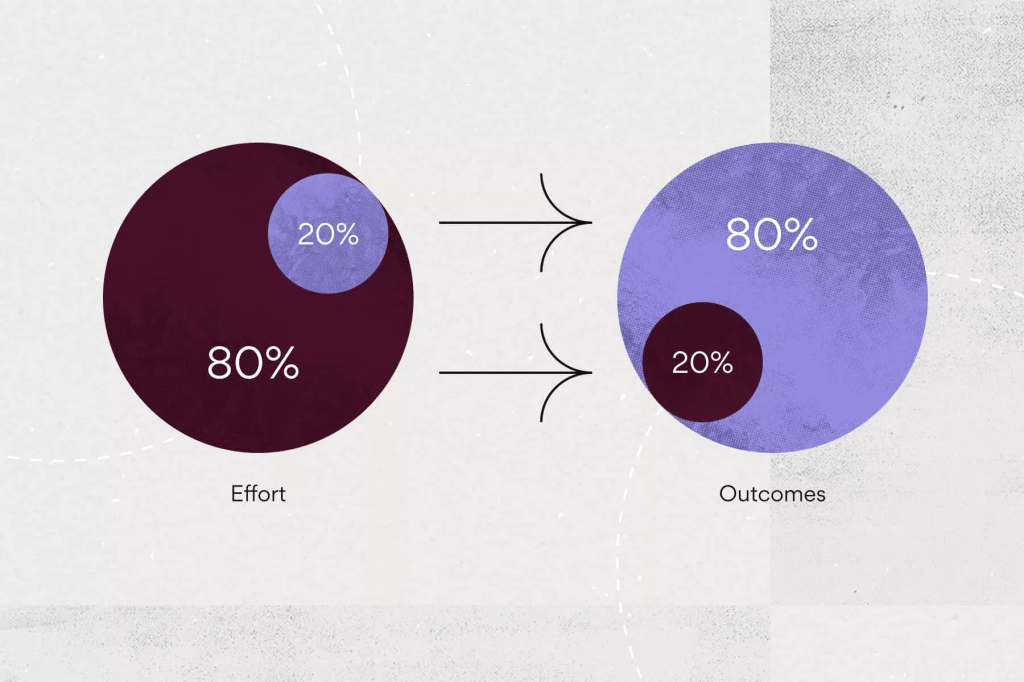
In 2023, 43.4% of the league scored ~80% of the runs, 42.7% of the league generated ~80% of the RBIs, and 36.6% of the league hit ~80% of the home runs. Perhaps the most elite group to be in is the 26.1% of the league that stole ~80% of the bases throughout the year.
As mentioned previously, there were 655 unique players to have at least 1 plate appearance last season, which comes to an average of 25.6 batters per team. Injuries, resting players, trades, and calling up players from the minor leagues leads to several players being used throughout the season outside of the starting 9 batters in the lineup. Even within the lineup a manager may set his lineup to provide the best hitters the opportunity to generate production.
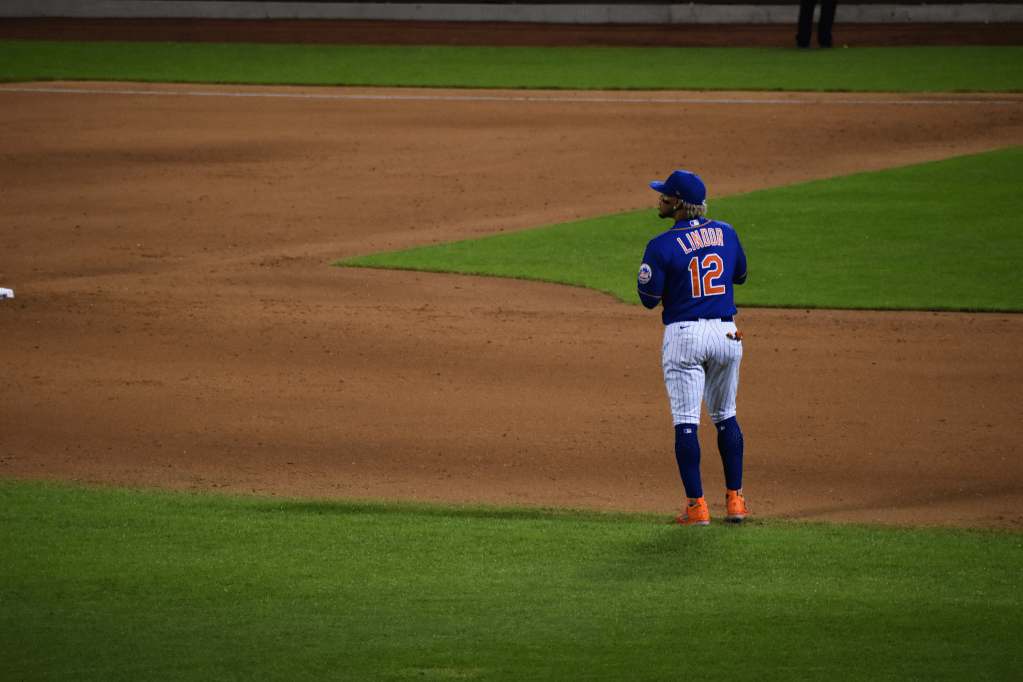
Using the New York Mets as an example Pete Alonso & Francisco Lindor combined for 216 of the teams 692 RBIs (31.2%) and they were just 2 players of the 24 (8.3%) to register a plate appearance for the team in 2023. Another example of production above roster distribution are the Seattle Mariners who had 4 out of their 22 batters (18.2%) account for 50.9% of their team’s 216 home runs.
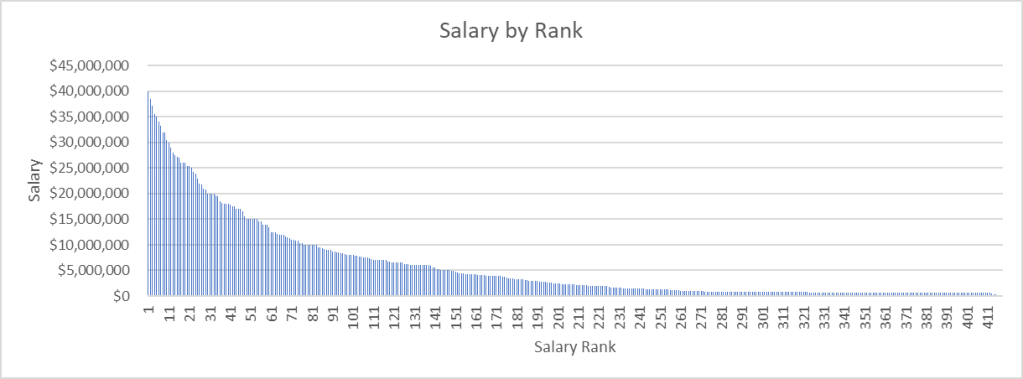
Of the 655 players to have at least 1 plate appearance in 2023, there are 419 with salary information available to public and they earned a total of $2.47B, with Aaron Judge being the highest paid player at $40.0M (1.6% of league total). ~80% of that total salary is allocated to 31.5% of the player pool. Those same 419 players generated a total WAR of 542.1 and ~80% was attributed to 26.5% of the player pool. This suggests that some players may be overpaid given their production, or high paid players had shortened seasons due to injury, but the gap between WAR and salary is only 5% also implying distribution of salary is relatively efficient.

Much of the league is earning toward the lower end of the salary distribution, because they haven’t accumulated enough service time to make it to arbitration or free agency, but with 26.5% of the player pool generating 80% of the WAR, it makes sense to pay them proportionally.
When a team has an opportunity to sign a player in Free Agency or trade for a player that consistently stays on the field and provides offensive production they should be willing to allocate a significant proportion of their budget to acquiring them. Its not uncommon to pay a few players significantly more than the rest of the roster, because they will be producing more than the rest of the roster. Such is the case of Aaron Judge earning $40.0M in 2023 producing a 4.5 WAR for a Yankees team that has a total WAR of 8.4.

