
For over 155 years, there has been a form of organized baseball being played in the United States. Baseball Reference provides the public with league, team, and individual player stats back to 1871, and observing trends over time can reveal the impact of changes that occurred by direction of Major League Baseball, the geo-political landscape, and culture.
Across several disciplines of Earth Science and Geology, scientists can get a look into the past by observing patterns from cores of the Earth’s crust, ice, rocks, or even the rings of a tree. By looking at the differences between bands, scientists receive clues into what was happening on Earth at the time.
The scientific community can do this because all else has remained equal; the Earth has had the same revolution on its axis, rotation around the sun, and has been at approximately the same distance from the sun for billions of years. Time series in data can provide this type of analysis for baseball as well. For 155 years baseball has been played under practically the same rules and same dimensions. A batter must reach base safely by putting the ball in play, and reach 1st base before receiving 3 strikes within a designated zone. Alternatively, if the pitcher throws 4 pitches outside of this zone and an attempt to swing does not occur, the batter is awarded first base on a walk.
Furthermore, similar to scientific research, baseball has always been played with the distance to 1st base being 90 feet, and the distance from the pitcher’s mound being 60.5 feet. This has created the greatest controlled test for a single statistic in sports: On Base Percentage with 155 years of data, and all else being equal.

There have been four distinct moments in Major League Baseball history that have led to the largest statistically significant shifts in on-base percentage. These are: 1921, 1942, 1969, & 1994.

1921: The End of the Dead ball era
The ‘Dead Ball’ Era was a time in Major League Baseball which stands out for the lack of offensive production from 1901-1920. The term ‘Dead Ball’ is derived from the baseball itself. During this time period the same ball was used throughout the entire game, often becoming muddy, scuffed, or torn as the game went on. Additionally the use of ‘doctored’ pitches such as ‘spitballs’ were allowed, these factors gave pitchers an advantage.

Some of the best players of the Dead Ball Era were Christy Mathewson, who pitched 3 complete game shutouts over 6 days in the 1905 World Series, to lead the Giants to a victory, Walter Johnson, who holds the record with 110 career complete game shutouts, 90 of which came in the 14 year stretch of 1907-1920, and Cy Young, who the award for best pitcher each season is named after, and holds all time pitching records for WAR, wins, complete games, and innings pitched.
There were some offensive standouts of the Dead Ball Era, such as Nap Lajoie, Eddie Collins, Honus Wagner, John McGraw, & Shoeless Joe Jackson, each of whom was known for their ability to put the ball in play, with the first three reaching the plateau of 3,000 career hits, but these players were not known for their aptitude to hit home runs.
The Dead Ball Era came to an end in 1921 due to a number of contributing factors, but primarily the introduction of more new baseballs per game, and the outlawing of certain pitches such as spitballs. This change had an immediate effect on the game.
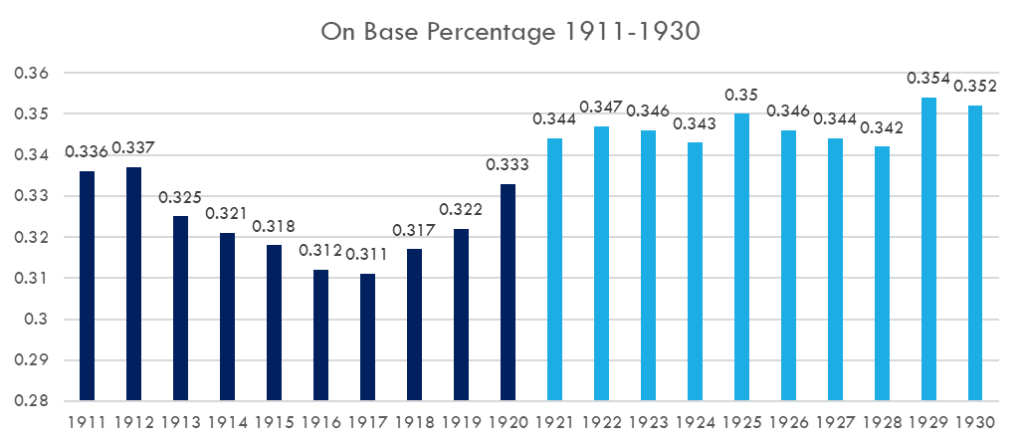
Below outlines the number of times players reached base and the number of opportunities they had to do so from 1911-1920 & 1921-1930. By introducing the changes, the average on-base percentage increased from 0.323 to 0.347. This change is statistically significant at 95% confidence interval.
1911-1920: 0.323 OBP (328,852 OB/1,017,454 OPP)
1921-1930: 0.347 OBP (440,909 OB/1,271,387 OPP)
1942: The United States enters World War II
After the Dead Ball Era, Major League Baseball was more popular than ever with the 1920s led by household names like Babe Ruth, Lou Gehrig, & Rogers Hornsby and the 1930s introducing fans to Joe DiMaggio, Mel Ott, and in 1939, Ted Williams.
On December 7th, 1941 the United States endured an attack on Pearl Harbor by Japan, and the following day the U.S. formally declared war with Japan. Just days later, on December 11th, 1941, Germany & Italy who were aligned with Japan, declared war on the US.

The decision to enter World War II was not a choice of Major League Baseball, but certainly had an impact on the game. As every healthy American was expected to give their best effort to win the war, several of the game’s best players entered military service and the impact to on-base percentage can be seen. From 1942-1946 OBP decreased from 0.339 to 0.326 versus the 5 year period prior, and after the war, OBP increased from 0.326 to 0.340, returning almost exactly to where it was before the war started. Each of these periods are statistically significant at a 95% confidence interval from 1942-1946.
1937-1941: 0.339 OBP (191,222 OB/564,419 OPP)
1942-1946: 0.326 OBP (182,454 OB/559,666 OPP)
1947-1951: 0.340 OBP (175,290 OB/514,861 OPP)

Ted Williams could have retired as the greatest player to ever step foot on a Major League field, but service to his country took priority. Williams posted a 10.5 WAR in 1942, a year after hitting to a 0.406 batting average in 1941. From 1943-1945 he served in the US Navy. After a season in 1951 where he led the league with a 0.464 OBP and 7.1 WAR, Williams was selected from a list of inactive reserves to serve in the Korean War in 1952. More details on his service can be found in this article by MLB.com.
1969: Major League Baseball Lowers the mound
The 1960’s in Major League Baseball were dominated by pitching, with big names like Bob Gibson, Sandy Koufax, and Juan Marichal leading the charge within the decade. The pitching dominance was most noticeable in 1968 when league on base percentage dropped to .299, the first season below .300 since the Dead Ball Era (1908, .297).

In 1968, it was also 2 pitchers to win the Most Valuable Player Award; Bob Gibson in the National League, and Denny McLain in the American League. Major League Baseball saw a need for change and decided to lower the mound 5 inches. Their hypothesis was lowering the mound would lead to boost offense and create a game with more offense to be more exciting for spectating fans.
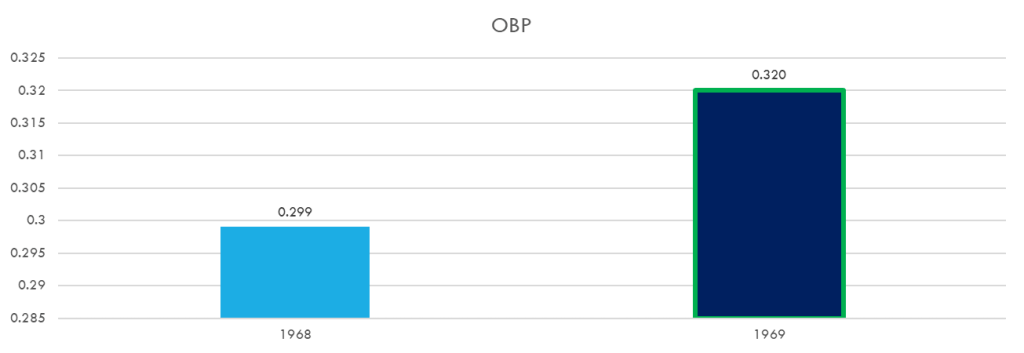
Major League Baseball accomplished what it set out to do in 1969. By lowering the mound by 5 inches from 15 inches to 10 inches, pitching had less of an advantage, and on base percentage increased from 0.299 to 0.320. This change is statistically significant at 95% confidence interval.
1968: 0.299 OBP (37,810 OB/120,835 OPP)
1969: 0.320 OBP (47,426 OB/148,207 OPP)
1994: Players Union Strikes, World Series is Cancled, & The Steroid era begins
In 1994 the Major League Baseball Players Union went on strike. The cause for the strike was a dispute between the owners and the players, when the owners proposed a salary cap for team payrolls and revenue sharing among teams for local broadcasting of the games. The owners approved of the new changes, but needed player approval as well.
The players did not agree to the terms of the proposal and decided to go on strike, with play ceasing on August 12, 1994. There would be no World Series played that season. There was significant fallout and many of baseball’s ‘What Ifs’ came from the absence of play in 1994, but non were larger than what Major League Baseball would do (or not do) to get the fans back.
It was obvious to decades long fans that a change was occurring in the game they have been watching their entire life. Players were physically larger, pitches were being thrown faster, baseballs were being hit harder and further, it was something not natural. That change was of course the wide spread use of steroids by players.
Most fans were aware of what was occurring in the league, and it is difficult to believe that owners, players, and the Office of the Commissioner were not aware of the usage of steroids to gain an advantage, but broadcast television viewership was up and fans in the stadium were returning. During this time period MLB was losing fandom to the NBA & NFL, and they needed to keep it.
Home runs were being hit at a rate not seen since Babe Ruth & Roger Maris, with big names synonymous with the Great Race of ’98, like Mark McGwire, hitting 70 home runs and Sammy Sosa, hitting 66 home runs. Eventually, Barry Bonds would become the single season home run record holder with 73 in 2001, which still stands today.
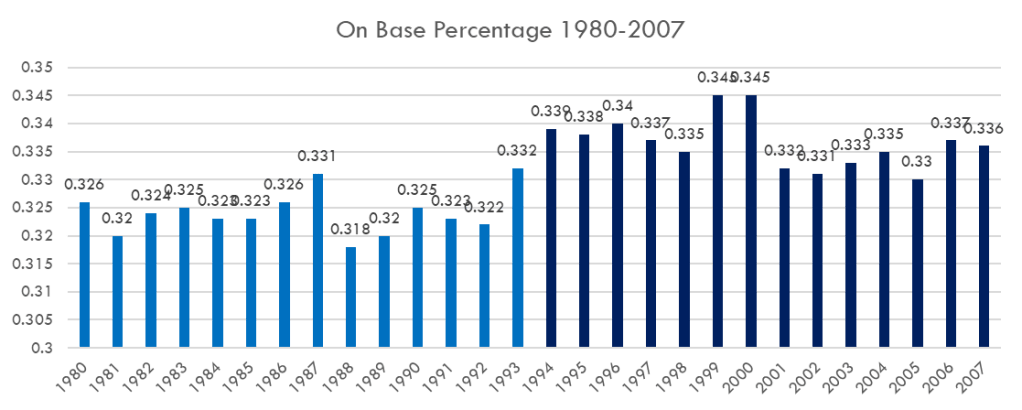
Comparing the periods of 1980-1993 and 1994-2007, OBP increased from 0.324 to 0.337, with a distinct difference over each 14 year period. Not only was OBP effected by the use of steroids, but increases in ERA, batting average, and slugging percentage can be observed. This 0.013 increase in OBP is statistically significant at 95% confidence interval.
1980-1993: 0.324 OBP (716,088 OB/2,208,073 OPP)
1994-2007: 0.337 OBP (846,419 OB/2,514,816 OPP)
Whats next & What does baseball teach us?
There are several changes that may lead to significant shifts in on base percentage across the league. Recent changes that MLB has made include: introduction of the pitch clock, three batter minimum for pitchers, and prohibiting sticky substances for pitchers.
These changes haven’t contributed a shift in on base percentage as significant as the ones mentioned previously, but perhaps there will be one soon. MLB has mentioned the idea of ball-strike challenges leveraging ‘robotic umpires’ and have tested it in spring training and the minor leagues. Perhaps this will provide an edge to batters or pitchers and cause a shift in OBP.
With the parameters of how baseball is played remaining consistent for over 155 years, there is something more to distill than just observing the shifts in on base percentage.
The game has been designed perfectly, to the fact that no matter who is playing, the success rate of reaching 1st base is generally between 30-35%. All of the players mentioned previously have played under the same rules, with the same 60.5 foot distance to the pitcher’s mound, the same 90 foot distance to first base, and despite all the changes in culture, technology, science, nutrition, geo-politics, physical training, etc. the probability of reaching first base safely has remained consistent.
It is a beautiful part of the game where older generations will argue the players they watched are better than anyone playing today, and the younger fans claim that Paul Skenes would strike out Babe Ruth on 3 pitches.

That opinion by younger fans may be true, but given the consistency of on base percentage; which in its essence is the primary goal of the game, it points to the innate human ability to adapt and overcome. There was never a prolonged break in baseball, players did not evolve from Babe Ruth to Paul Skenes overnight, they slowly adapted over time.
When pitchers started throwing harder and with more movement, batters started to swing sooner and more precisely; when batters started to get an edge on pitchers, the pitchers started throwing harder and with more movement.
The game of baseball has developed across generations and every generation plays harder. The initial seasons were played by ballplayers whos primary occupation was not baseball, and now its played by ballplayers who have never done anything other than baseball.
With that said, what is next? How much faster can baseball players physically throw? How fast is too fast to physically hit? When will Major League Baseball need to intervene again like in 1968?
These are questions we don’t have answers to, but until then, baseball remains the perfect game.

_(LOC).jpg)